

آخر الأخبار
عربي ودولي
المزيد
أمير الكويت يتلقى رسالة خطية من رئيس وزراء بنغلاديش لتعزيز العلاقات الثنائية
تسلم أمير دولة الكويت، سمو الشيخ مشعل الأحمد الجابر الصباح، رسالة خطية من رئيس وزراء بنغلاديش، طارق...

تنسيق كويتي-قطري رفيع المستوى حول وساطة باكستان بين واشنطن وطهران
بحث وزيرا خارجية الكويت وقطر آخر التطورات الإقليمية وجهود الوساطة الباكستانية بين الولايات المتحدة و...
رياضة

انطلاق مباريات نصف نهائي كأس عاصمة مصر اليوم
تنطلق مساء اليوم الاثنين، 25 مايو 2026، منافسات ذهاب الدور نصف النهائي لبطولة كأس عاصمة مصر في نسختها الخامسة، بمباراتين...

مفاجآت في قائمة منتخب مصر الأولية لكأس العالم 2026
أعلن حسام حسن، المدير الفني لمنتخب مصر، عن قائمة الفراعنة الأولية المكونة من 27 لاعبًا لنهائيات كأس العالم 2026، وشهدت ا...

الزمالك يتوج بلقب الدوري المصري الممتاز للمرة الخامسة عشرة في تاريخه
حقق نادي الزمالك لقب الدوري المصري الممتاز لموسم 2025/2026 بعد فوزه في الجولة الأخيرة على سيراميكا كليوباترا، ليعزز رقمه...
اقتصاد

ترقب خليجي لتأثير خفض الفائدة العالمية على الاستثمارات والسيولة
تستعد اقتصادات دول مجلس التعاون الخليجي، بما فيها الكويت، للتداعيات المحتملة لخفض أسعار الفائدة من قبل البنوك المركزية ا...

الكويت تعزز خطط تنويع الاقتصاد عبر التركيز على الابتكار والخدمات اللوجستية
تسعى الكويت جاهدة لتسريع وتيرة تنويع اقتصادها بعيداً عن النفط، من خلال إطلاق مبادرات طموحة لدعم قطاعي التكنولوجيا والخدم...
حوادث وقضايا
مجلس التعاون يشدد على التنسيق الأمني لمواجهة التحديات الإقليمية
في ظل التوترات الراهنة والمتغيرات المتسارعة، أكد الأمين العام لمجلس التعاون الخليجي على ضرورة مضاعفة التنسيق الأمني بين...

أحكام بالمؤبد بحق متهمين بالتخابر مع الحرس الثوري في البحرين
أصدرت محكمة بحرينية أحكاماً بالسجن المؤبد بحق تسعة متهمين بالتخابر مع الحرس الثوري الإيراني، في قضية أمنية خطيرة تتعلق ب...

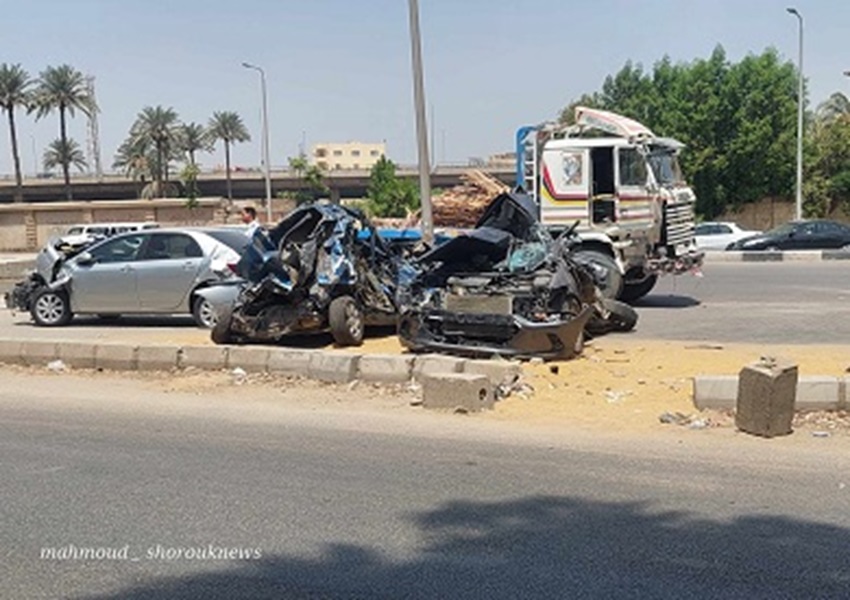
نجاة أم ورضيعها من حادث دهس مروع في دبي
وثقت كاميرات المراقبة في دبي لحظات مرعبة لنجاة أم ورضيعها بأعجوبة من حادث دهس على معبر للمشاة، مما سلط الضوء مجدداً على...
محليات

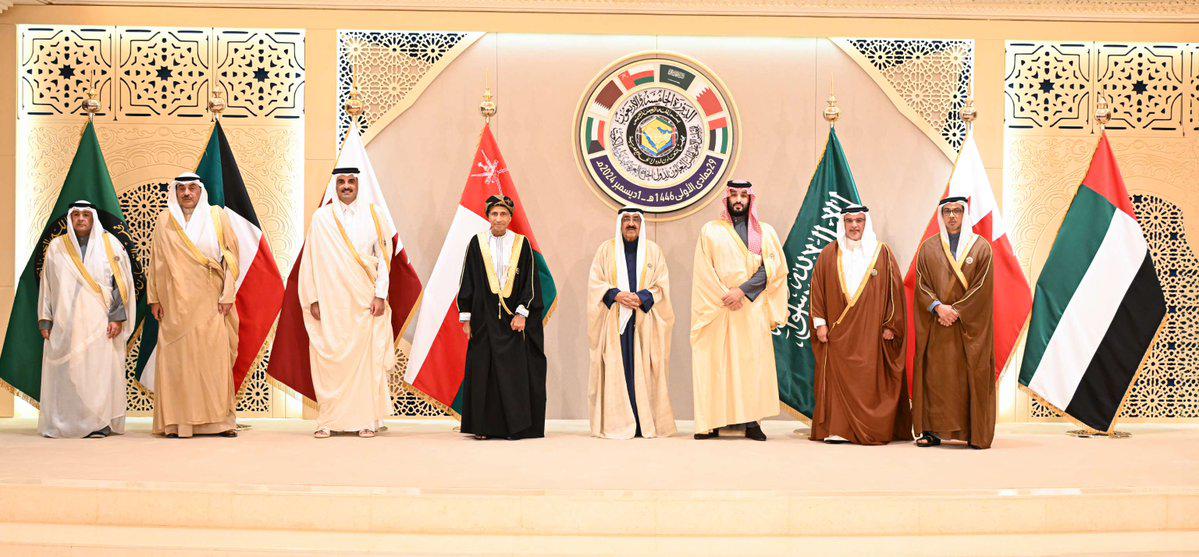
الكويت تحتفي بالذكرى الـ45 لتأسيس مجلس التعاون الخليجي
أعربت وزارة الخارجية الكويتية عن اعتزاز دولة الكويت بالذكرى الـ45 لتأسيس مجلس التعاون لدول الخليج العربية، مؤكدة على الد...

قوة الإطفاء تسيطر على حريقين في مصنع ومبنى سكني دون إصابات
تمكنت فرق قوة الإطفاء العام فجر اليوم الاثنين من السيطرة على حريق اندلع في مصنع للورقيات بمنطقة ميناء عبدالله، بالإضافة...

الكويت تدين التفجير الإرهابي في باكستان وتؤكد رفضها للعنف
أعربت وزارة الخارجية الكويتية اليوم عن إدانة واستنكار شديدين لعملية التفجير الإرهابية التي استهدفت قطاراً في إقليم بلوشس...
شـؤون خارجية
أمير الكويت يتلقى رسالة خطية من رئيس وزراء بنغلاديش لتعزيز العلاقات الثنائية
تسلم أمير دولة الكويت، سمو الشيخ مشعل الأحمد الجابر الصباح، رسالة خطية من رئيس وزراء بنغلاديش، طارق رحمن، تناولت سبل تطو...
تنسيق كويتي-قطري رفيع المستوى حول وساطة باكستان بين واشنطن وطهران
بحث وزيرا خارجية الكويت وقطر آخر التطورات الإقليمية وجهود الوساطة الباكستانية بين الولايات المتحدة وإيران لخفض التصعيد و...
.jpeg)
تعديل جيني ثوري يعيد الأمل لمرضى ضمور العضلات
استخدام جيل جديد من تقنية "كريسبر" لإصلاح الجينات المسببة لمرض ضمور العضلات بنجاح في التجارب السريرية الأولى.
خدمة أنت عين الخبر
شاركنا التغطية وانقل لنا نبض الحدث بالصورة أو الفيديو أو الصوت. خدمة "أنت عين الخبر" تتيح لأي شخص حول العالم أن يكون عيناً على الحقيقة ومساهماً فاعلاً في نقل الوقائع والأخبار والمبادرات بكل سهولة ومصداقية.
آخر مشاركات عين الخبر

مكتبة حماك الصوتية والبودكاست
استمع الآن إلى مجموعة مختارة من الحلقات الإذاعية المسجلة، التقارير الصوتية، والبودكاست الحصري لصحيفة حماك. تصفح حسب الفئات الصوتية أو مقدمي البرامج المفضلين لديك بتجربة تشغيل ذكية ومستمرة.
المجموعات النقاشية
شارك برأيك وانضم إلى حوارات تفاعلية بناءة حول مختلف الموضوعات والقضايا المجتمعية. تمكنك منصة المجموعات النقاشية من تبادل الأفكار، إنشاء مجموعات اهتمام مخصصة، والتفاعل الفوري مع أعضاء المجتمع بكل سهولة وشفافية.
ساحة منافسة حماك الثقافية
منصة تفاعلية لتحدي أصدقائك في شتى مجالات المعرفة والثقافة. اختر مجالات التحدي، أنشئ غرفتك الخاصة، ونافس في أسئلة ذكاء وسرعة ممتعة تزيد من حصيلتك المعرفية وتثبت جدارتك.
خدمة حماك الخيرية
بوابة تكافلية إلكترونية تتيح للأسر المتعففة ومقدمي طلبات المساعدة تقديم طلباتهم بشكل رسمي وسري. يمكنك اختيار الفئة المناسبة لطلبك، تعبئة البيانات المطلوبة وإرفاق الأوراق أو الفيديوهات الداعمة لطلبك لمساعدتنا على مراجعته وتلبيته.
سوق حماك الإلكتروني
اكتشف وتصفح الآن العديد من الفئات المميزة والمنتجات الحصرية المتوفرة في سوقنا الرقمي. تتيح لك المنصة استعراض السلع والخدمات المعروضة من قبل المستخدمين، بالإضافة إلى إمكانية إضافة إعلاناتك الخاصة والترويج لمنتجاتك بكل سهولة وتواصل مباشر.